Performance Measures
Comparison Of Actual And Budget Expense
The Goal Of The District Is To Not Exceed The Annual Approved Budget

Designation Of Reserves
The Goal Of The District Is To Maintain A Four Month Operating Reserve 100% Of The Time

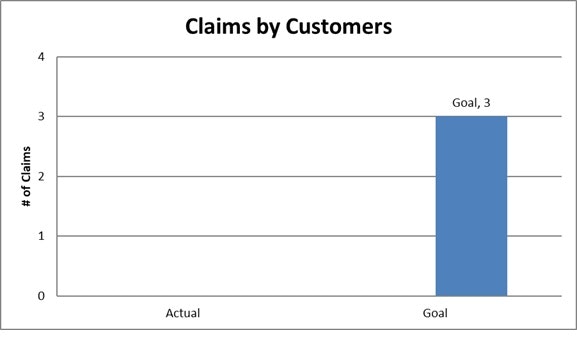
Claims By Customers
The Goal Of The District Is To Have No More Than Three Claims Per Year

Customer Complaints
The Goal Of The District Is For Customer Complaints Not To Exceed .1% Of Our Approximately 7,400 Customers

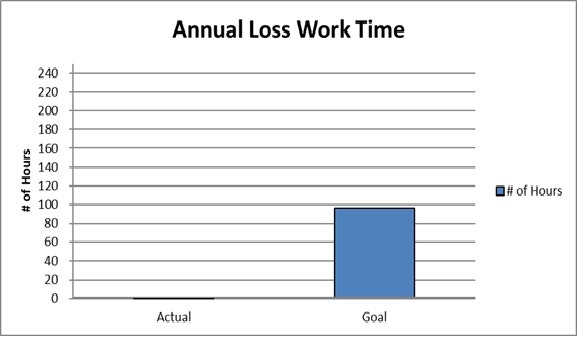
Loss Work Time (worker's Compensation)
The Goal Of The District Is To Experience Loss Work Time Of No More Than 8 Hours Per Month/96 Hours Per Year, About .002% Of The Hours Worked

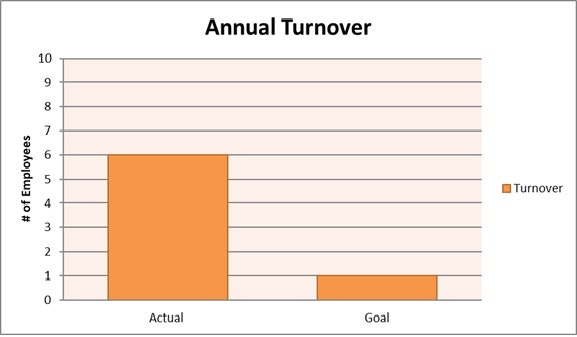
Employee Turnover
The Goal Of The District Is To Retain Staff And Minimize Turnover To One Position (4% Of Staffing) Per Year

Maintenance Management
The Goal Of The District Is Not To Exceed More Than 5% Backlogged Work Orders Per Month

Water Quality
The Goal Of The District Is 100% Compliance For Water Quality

Disruption Of Service
The Goal Of The District Is To Complete Repairs Disrupting Water Service In Under 5 Hours

NPDES Requirements
The Goal Of The District Is To Meet 100% Of The Permit Limits 100% Of The Time

Maintain Sewer System
The Goal Of The District Is To Clean And/or Video The Entire Collections System Every 3 Years Or Less (the National Standard Is 3 To 5 Years)

Overall Wastewater System Maintenance
The Goal Of The District Is Not To Exceed More Than 5% Backlogged Work Orders Per Month

